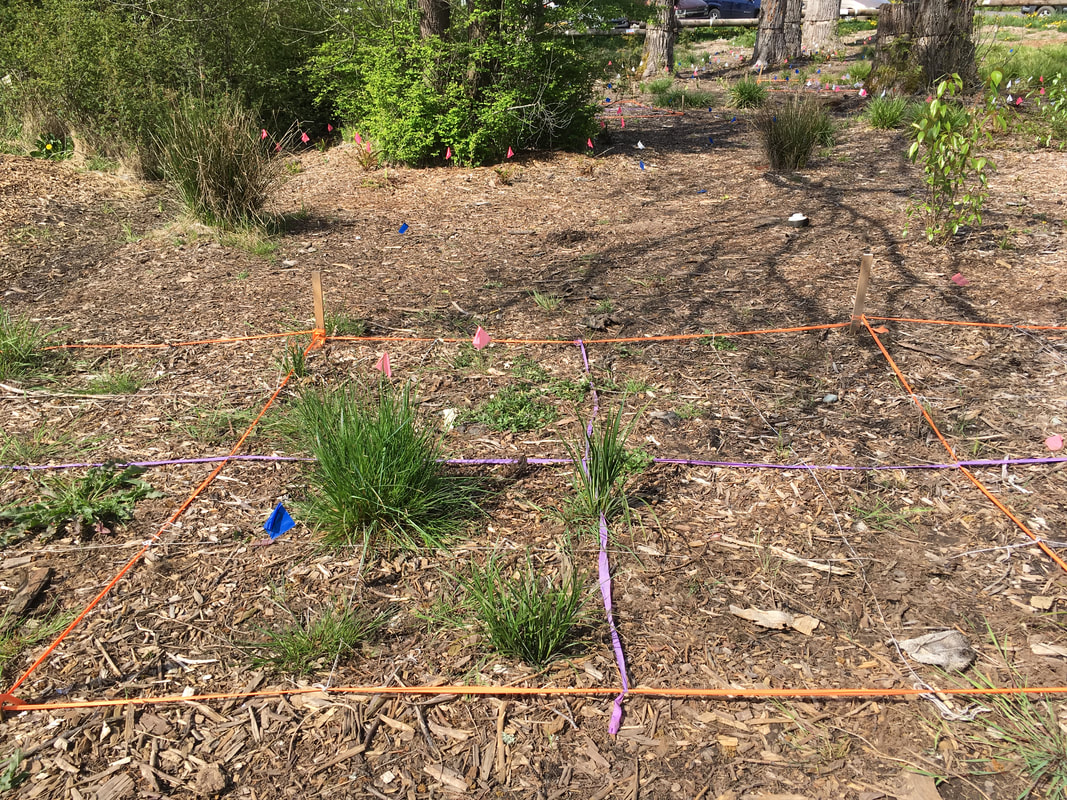
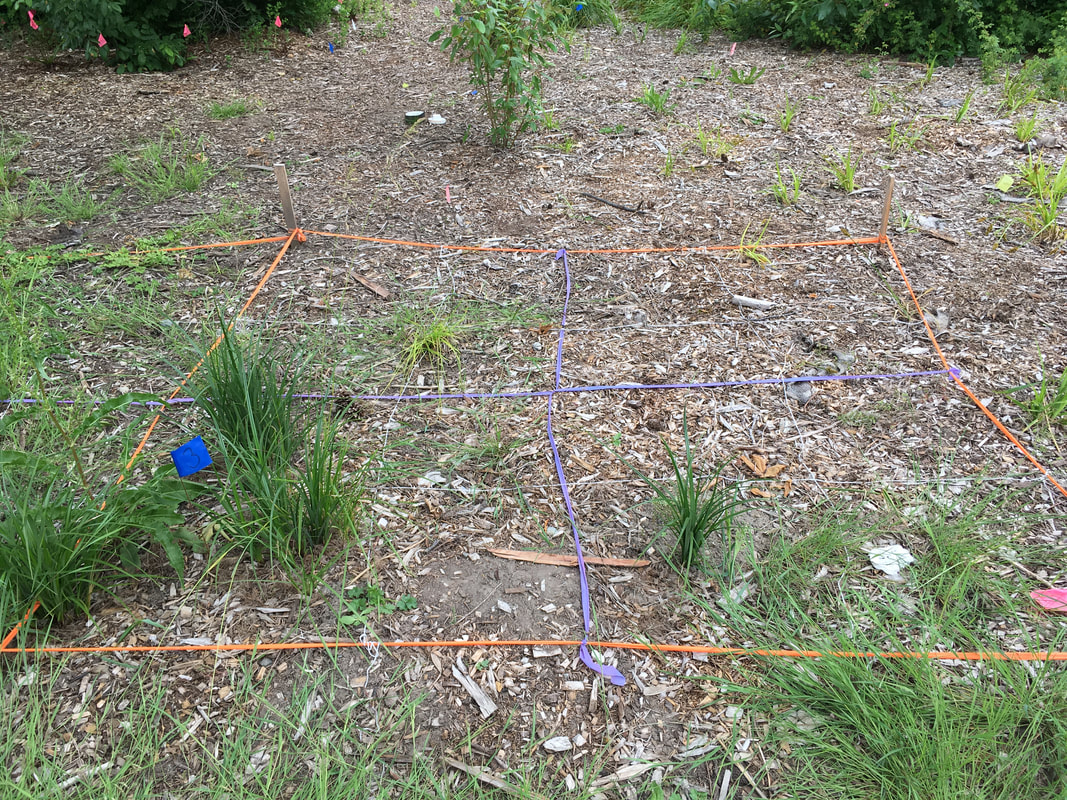
James.The graph below represents the percentage covered on plot two over the course of three months. The pictures are of the plot over the course of the three months. 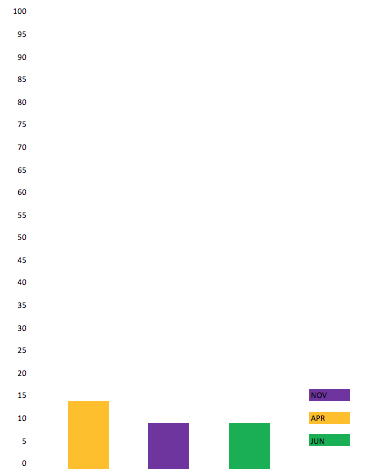 "Water is life. Land is blessing. Water and Land are existence. So can we agree wetlands are pretty awesome?'' Isaac.K Plant Coverage Changing by Season. November 2018 through April 2019 Plot 2 By James. Writing any kind of paper can be a challenge. Writing a paper structured upon data gathered by 11-year-olds can also be a lot harder. MAKING THE PAPER Making this paper was hard because of the inconsistency of the data we’re trying to gather. Charts are only completed in 3 out of the 8 months we worked on the wetland, so there was not a lot of data to pick through. Another reason it was hard to gather consistent data was bad handwriting of several of people that plotted the data. That mixed things up because it became hard to tell the difference between a 4 and a 9. I chose plot 2 because it was a good middle ground with an average amount of water. Then, I proceeded to draw a graph. It was hard to tell what graph would work the best, so I chose a bar graph. Now it was time to go places! Making the graph was a confusing procedure. First, I had to look at the data, to figure out the actual numbers for plant coverage. Then I had to convert the coverage of the plot into a percentage, to make the number more understandable. Finally, I drew the graph itself. Marking a percentage line all the way up to 100%, I marked the points on the line. Then I drew a conclusion. THE DATA. April had a bit more plants growing than in November. April had approximately 12.5% of the plot covered, June had around 6.25% covered, and November only had around 7% covered by the plants. April won out over November by 5.5%, and June lost to November by 1%. The outcome of this was kind of obvious, because fall doesn’t grow as much plants as spring in general. CONCLUSIONS. My conclusion is that it’s kind of hard to grow plants in the fall. And easier to grow them in the spring. So, I didn’t learn much straight-up information, but there are things that could be better about determining that. For example, this chart doesn’t measure height. Basically, you can grow plants better in spring than in fall. I think it pays to know how our wetland is doing so we can fix it, or improve it. It's also important to graph this information so we can see information we might have passed up before, and so we can see it clearer. THE END. Source Cited. STEM 5th Grade students, Research Data 2018/19.
2 Comments
Bob "The" Builder
6/20/2019 01:20:19 pm
Nice graph 2/2/2020 11:13:11 am
We are here for you on your insurance journey. If you need us to send files or give some generalized advice we are only a phone call or e-mail away. No one knows everything about all the companies or plans, but we will do our best to give you the best information we know. Leave a Reply. |
Authors:
|

 RSS Feed