Quantitative research: plot coverage change by season. April 2018-November 2019- June 2019. Plot 11.6/6/2019 Ray enjoys sports and music.the plot below is measuring plant coverage ,and it's the completed graph not the first one 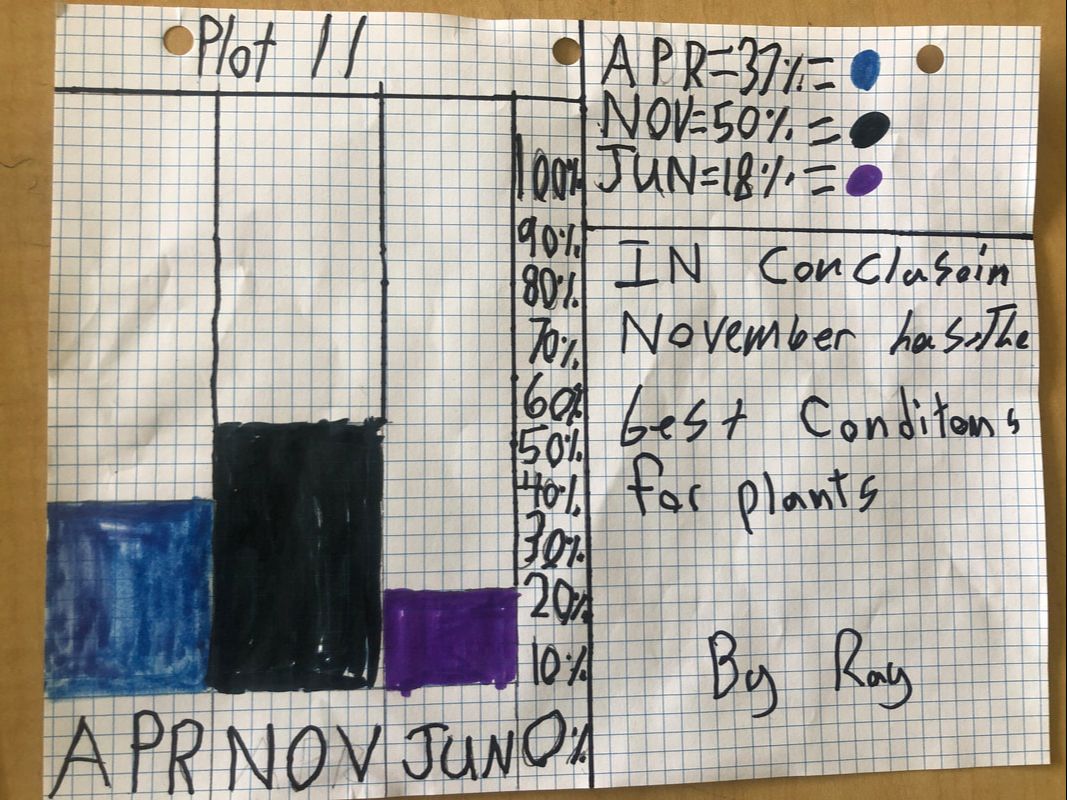 This paper below is not quit accurate. 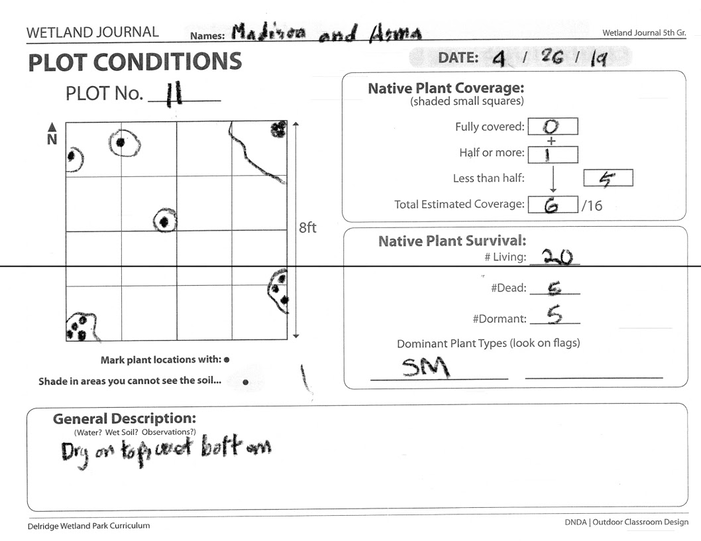 Plant coverage changing by season.
April 2018-November2019-June2019. Plot 11. By ray Does plant coverage change by season after its been growing for 1-2 years in our Delridge wetlands?(plant coverage is very important in a wetland because the plants filter water) I'm am guessing that there is a pretty big change because April to November then to June is a pretty longtime for plants to grow or die. Well guess what I’m here to tell you how big of a change there has been. This information has been graphed by fifth graders, so the data is not perfect but it’s close to the real information. I picked plot eleven out of twelve plots(a plot in this case is a area that has been graphed where plants are placed) to see the change through the seasons. I looked at the plot that we measured from April then I looked at the plot that we measured from November then June and there was a pretty big difference, so I decided to make a better graph so it would compare Aprils graph to November. I think it was very interesting because my partners graph was the exact opposite of mine. Instead of having fifty percent of plants in November he had seven, and in April I had thirty percent and he had twelve. June had finally come so we compared plots one more time I had seventeen percent(the plant decreasing is because of how hot it was in June so it killed lots of plants) and he had six point twenty five. My plant had more plot coverage through all the seasons so I predict that it has to do with the fact that my plot was more by the pond and his was by a more dry area. We changed a lot in the second draft. The biggest thing that we did is we changed the graphs style so that it be a better fit for what we were trying to do. In conclusion plants cover more plot area and grow better in fall after growing and having good weather to grow for a while then in spring. Work cited STEM 5TH Grade students, Research Data, 2018/19 Control click to go to site.
2 Comments
Jason Medeiros
6/9/2019 01:06:32 pm
Great job sharing HOW you made this graph and the decisions you made. I would be interesting for readers to see the DATA SHEETS you used, so they better understand some of your challenges. Could you post photos?
Ms. Clevering
6/11/2019 06:02:23 am
Great job so far Ray. Leave a Reply. |
Authors:
|
 RSS Feed