|
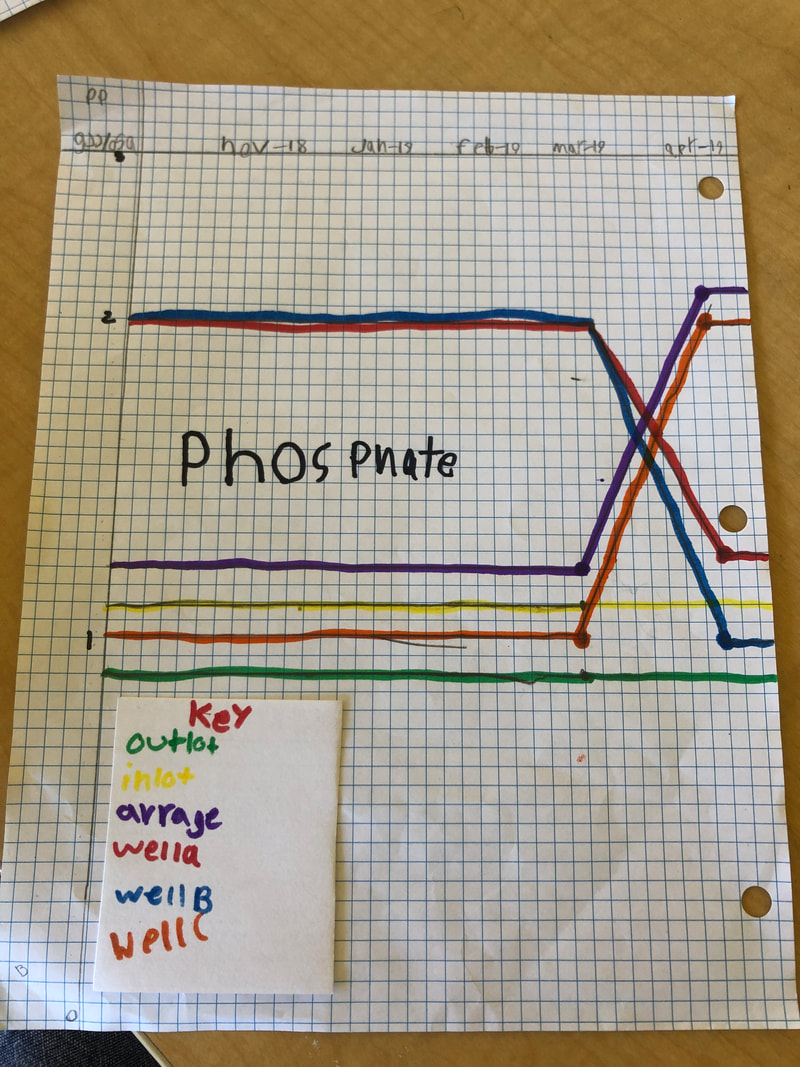
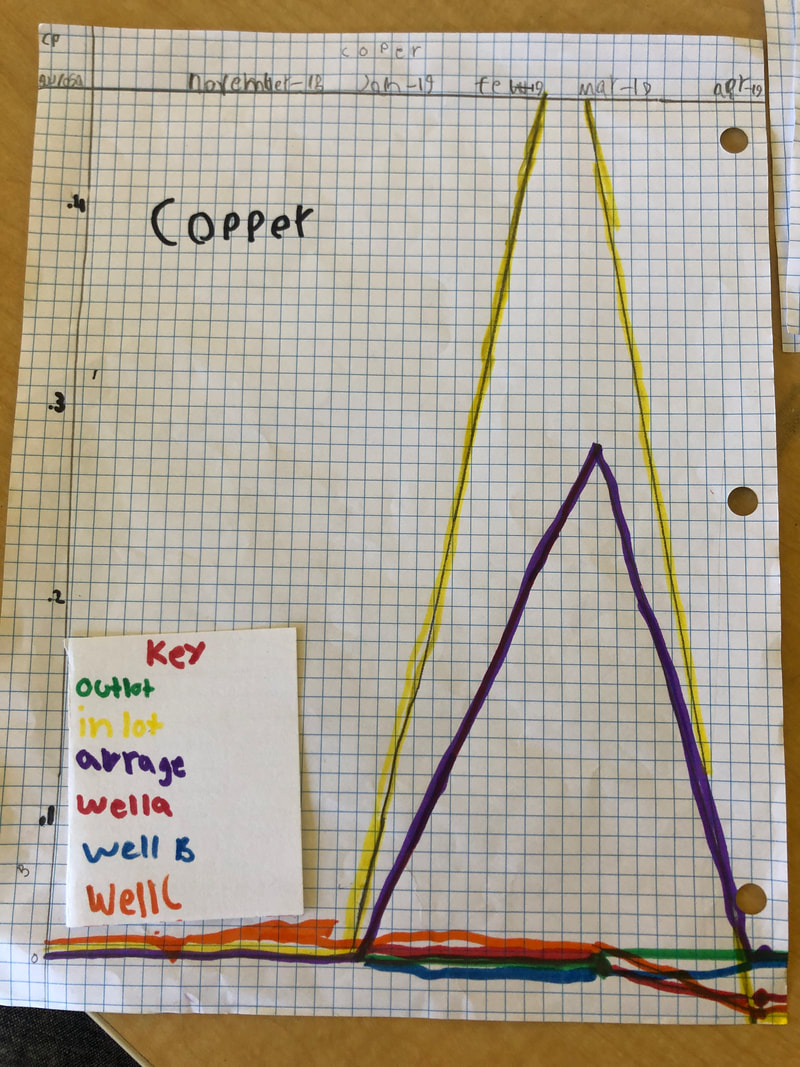
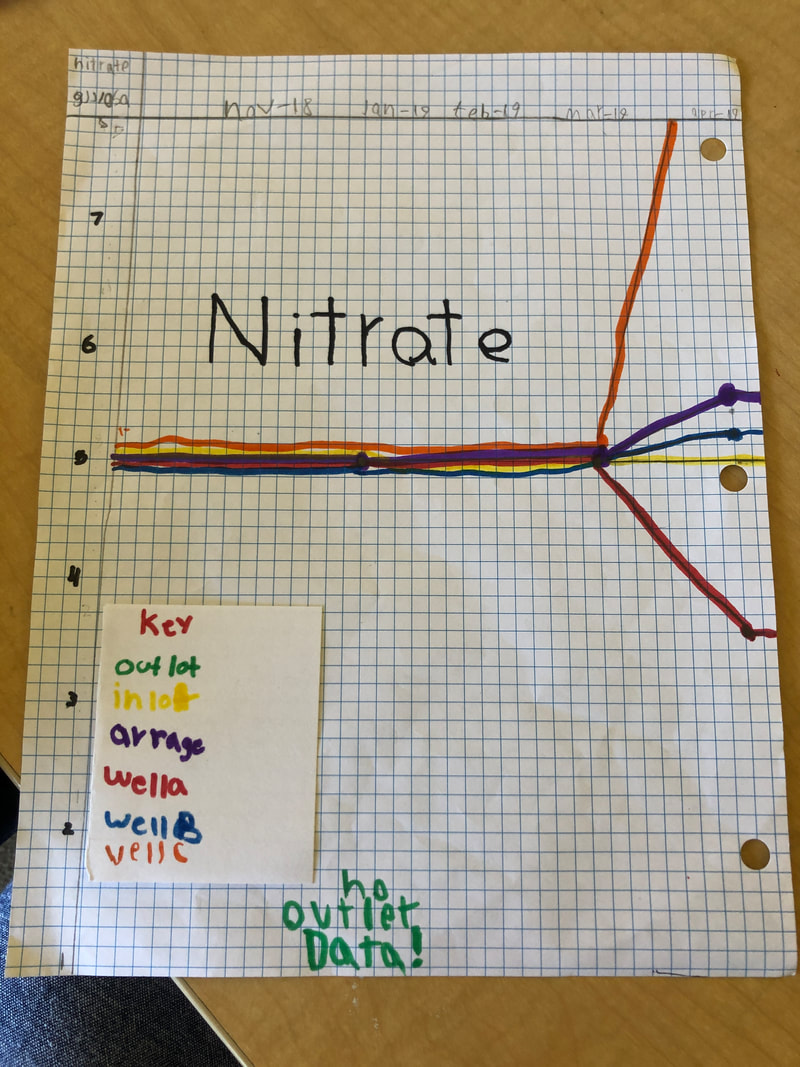
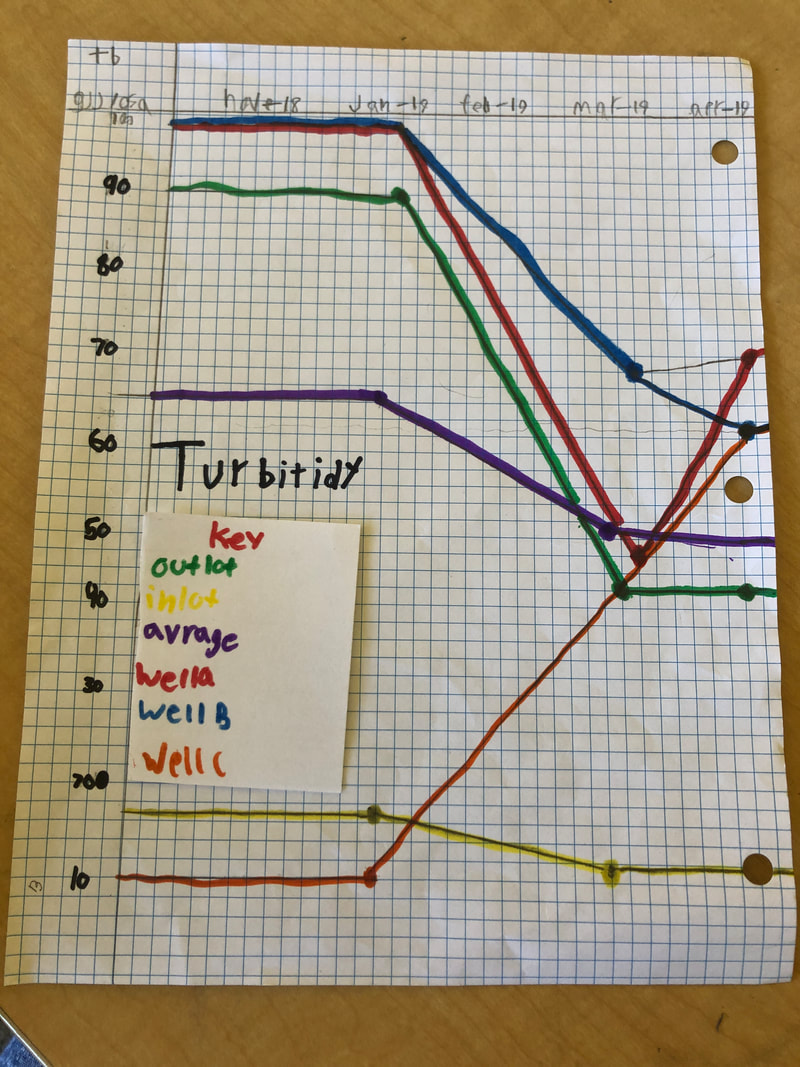
by Omar and Griffin Does pollution increase over time? The safe level of turbidity is 4. The average of turbidity stays be twin 70 and 60 then goes to 50. The outlet is at 90 and then goes to 50. The inlet stays at 70 the goes all the way to 10. Well A stays at 100 then goes to 50 then goes to 70. Well B is at 100 then goes to 60. This shows that tb is getting less pollution. The safe level of copper is 10. The average of copper stays at o then goes 3. The outlet stays at 0. the inlet stays at 0 then goes all the way to 5. Well a stay at 0. Well b stays at o. This shows that very hi but when it goes throw the proses it gets better. The the safe level of ph is 6.5 to 8.5 The average of ph. Stays at 6 then goes to 5 then goes to 6 again. The outlet is at 5 then goes to 6. the inlet stays at 6 well a stay at 6 then goes to 7. well b stays at 6 then goes to 7. this shows that pH is increasing by a little bit. The safe level nitrate is 1.0 The . average of nitrate stays at 5 then goes to 6. there is no outlet data. The inlet stays at 5. well a stay at 5 then goes to 4. well b stays at 5 then goes to 6. This shows that it mostly stays the same but well b goes down a lot. The safe level of phosphate 0.005 to 0.05. The average of phosphate is at 1 then goes to 2. the outlet just stays at 1. The inlet stays at 1. well a stay at 1 then goes to 2. Well b just stays at 2 then goes to 1. This shows that most of them stay the same. Works cited stem grade students research data 2018/19  Water Quality Notes
big take-aways pH – pH was always at a safe level. The outlet had visibly lower pH than the inlet. Nitrate – The fact that nitrate has no outlet data negates the purpose of this graph, but it appears that nitrate levels fluctuated throughout their passage through the wetland. Copper – Copper from the inlet was extremely high, but the wetland seemed to negate it entirely, which is promising. Phosphate – Phosphate fluctuated greatly, but the outlet water was considerably lower than the inlet. Turbidity – We have awfully turbid water; all levels are above safe. works sited STEM 5th grade students, Research Data, 2018/19.
1 Comment
jason
6/19/2019 09:38:57 am
This represents lots of effort! Can you make sure both student names are on the post? Leave a Reply. |
Authors:
|

 RSS Feed